
AI didn't create the
overwhelm.
It's just the latest cause.
Leaders keep describing the same feeling: unsure if they're keeping up, unsure if they're doing it right. AI is only the most recent trigger. Before AI it was the Great Resignation. Before that, COVID-19. Each wave hit fast, knocked boards on their heels, left employees thinking about work in new ways, and leaders with less certainty than before.
Start with people.
The technology comes second.
Most AI rollouts start with a tool. Pick the software. Announce the plan. Train people. Wait for adoption. Employees experience it as something that happens to them.
We start somewhere else. We help teams map their own work first: what takes the most time, what creates the most value, and how people actually feel doing it. That map shows exactly where automation should start.
Usually it's the work that's high friction or the work that pulls people away from what matters most.
This map highlights the work the tasks that add the least value and gives leadership an answer on where AI investment should go first.
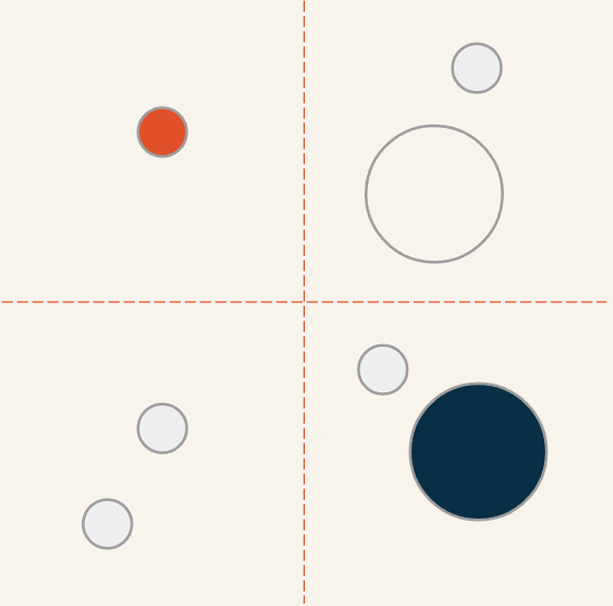
The map shows you how best to integrate AI into the work.
Tool first vs. people first
11fold's approach
People first
Map the work with the people doing it. Find where friction is highest and value to the person is lowest. Target automation there first.
What this builds
Trust, and a real AI roadmap
People trust changes they help design. Leadership gets a roadmap grounded in where the friction is, not where someone assumed it would be.
The Bubble Chart:
how we find where AI should start
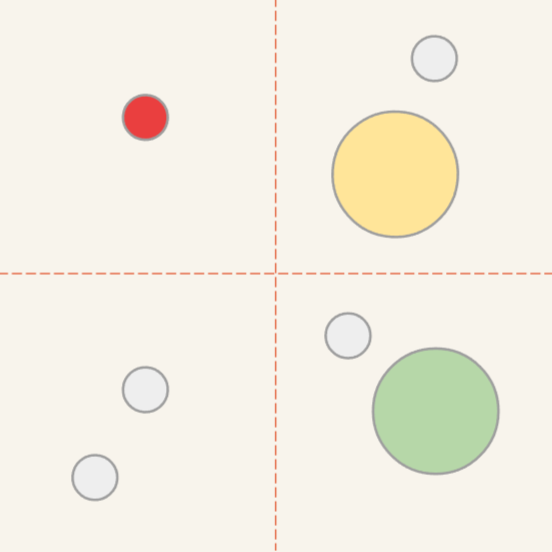
Each person maps their own work
Every employee plots their work on two axes: business value created, and how closely the task fits the team's actual mission. Bubble size shows attention spent. Color shows how the person feels doing it: green for energizing, yellow for neutral, red for draining.
Map
Synthesize
The maps get combined across the org
Individual maps roll up into one picture. Work categories that are high attention, low value, and draining across many people become the clearest automation targets. Work that is high value and genuinely rewarding stay human, and are protected.
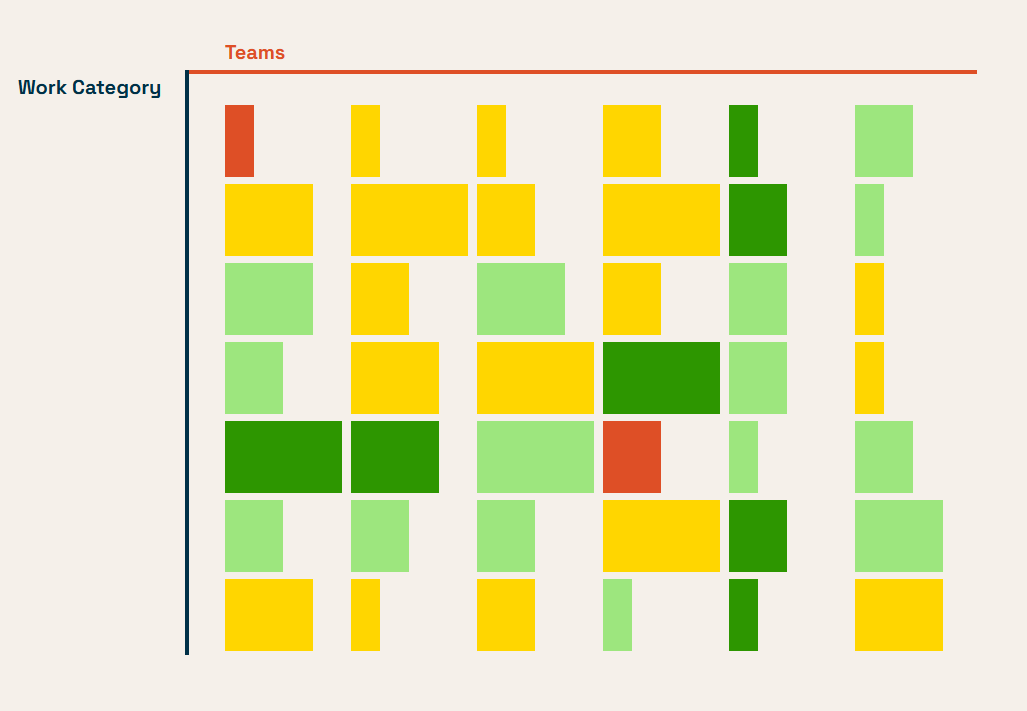
How Creative Force used the
11fold Bubble Chart
to identify the best tasks to automate with AI
Case Study:
Creative Force's People team, led by VP of People Astrid Riber Poulsen, had already been leading teams through the 11fold Bubble Chart activity. When AI came up, Director of AI Operations Aaron Horwath didn't start with a list of tools. He pulled the Bubble Chart data the team already had and used it to find the tasks that were both low value and low joy across the organization. Those became the first automation targets.
The Approach
The Impact
8 months → 10 hours
A customer product that once needed 20 people and eight months shipped in 10 hours with three to four, once AI took the grunt work.
Eliminated 44% of wasted time
We identified that 44% of engineering managers’ time was wasted waiting for others’ decisions, providing the data needed to streamline processes & governance.
Adoption that stuck
Aiming AI at the tasks people liked least built the buy-in that most AI rollouts never get.
“
The Bubble Chart offered some true “Aha” moments with regards to my team.
Eva Tjhie, Head of Customer Success, Creative Force
Ready to find out where
AI should start
in your organization?
We'll walk your team through the same diagnostic Creative Force used. No tool pitch first. Just a clear look at where the friction actually is.